Trading is a continuous learning experience. Market Profile is one of the best tool to organize market
generated information and help in spotting Intraday
and positional trading opportunities. Market Profile is not a time-based chart
rather it organized the Trading Data
and charts the relative frequency of trading at various price levels. By
organizing the trading data in terms of Alphabets (TPO) one can Study the Market
structure and market dynamics. The structure depicted by the Market Profile
reflects market-generated information; it represents the actual buy and sell
orders transacted in the market place.
Let’s look at the important
concepts of Market Profile
1. TPO
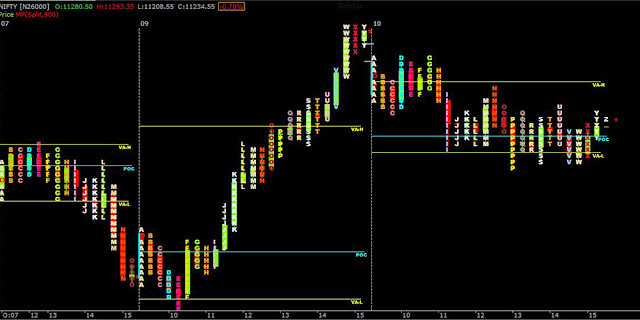
TPO or Time Price
Opportunity is the basic building block of Market Profile. Each and every
letter in the chart represents a TPO. Which in turn represents a point of time
where the market touches a price. Each consecutive letter generally denotes a
30min period of Market Activity.
2. Initial Balance (IB)
Initial Balance represents the
first hour of trade. Typically the high and low range of the letters ‘A’ &
‘B’. Longer the length of the Initial Balance stronger the conviction of Long term and Short term players. It’s
generally the first 60-mins of trading sets the tone of the day and gives us an
upper and lower price range to use as a reference point for the day
3. POC
The price that recorded the highest trading activity.
4. Value
Area
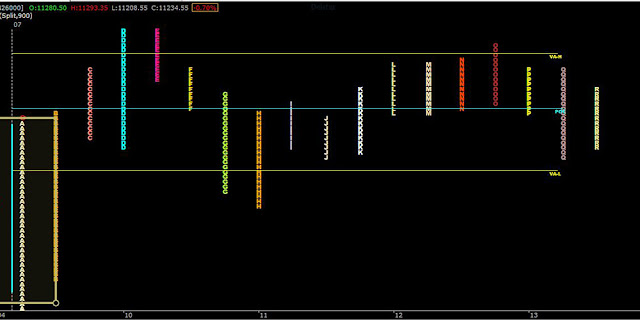
The Value Area represents the range of prices that contain 70% of
a day’s trading activity.
5. Value
Area High (VAH)
The upper level of the value area.
6. Value
Area Low (VAL)
The lower level of the value area.
When there is a series of
single tail letters above VaH & VaL, it is called as a single print buying
&selling tail respectively. This kind of tail represents a strong reaction
by the Other time frame trader(OTF).


