Showing posts with label stockmarket. Show all posts
Bull and Bear Market

Bull and Bear Market

Bull and Bear Market

Bull and Bear Market

When you are into the work of stock trading, you often hear the terms “bull” and “bear”. These terms are used to define market conditions. It is important to know and understand what the terms indicate, in order to understand the functioning of the market. Let’s understand what are bear and bull markets and which one is better Bear or Bull market? And then let’s dig deeper into it.
The words Bull and Bear are used to describe whether the market is appreciating or depreciating in value. Sometimes, these terms are also used to determine how investors think about the market and the subsequent trends.
In simple words, when the stock market rises high, it is said to be bullish or bull market. It is characterized by a continual increase in market share prices. When the market is bullish, most investors often believe that the uptrend will remain for a longer period of time.
On the other hand, the market is said to be bearish, when it is facing a downfall. A bear market is the indication of decline. In Bear Market, the share prices start dropping, and the economy of the country slows down.
Which one is better Bear or Bull market?
Both bear and bull markets have different impact on your investments. When the market is bullish, short term or intra-day trading takes a peek. On the other hand, the bear market brings long-term investment opportunities to investors. So it’s a good idea to spend some time to govern the market and make investment decisions accordingly.
Open vs High
Opening price is significant especially at the beginning of the market, to determine day trading strategies. The price at which stock first trade on trading day is known as opening priceOpen vs high-low generally gives you the first impression of how a stock will perform throughout that trading day. Hence, the effect of news, events reflects on opening price, at times leading to the opening of stock in gap up or gap down.
When this opening price is compared with High or low, it helps the trader to take an effective position in the market. Therefore, a specific feature where High price can be compared with low prices, would be beneficent for the trader.
Open vs High low can be understood into two sections, in order to generate Buy & Sell signal:-

Open  equals to high


Open  equals to high

This indicates Bearish trend as prices will probably move below high price. In other words, a trader can go Short.  Whereas Previous high will help a trader to identify breakout by comparing it with current day’s high price.

Open equals to low

Open equals to low


This indicates Bullish trend, thus a trader can go long. Here prices will possibly move upward beyond low price. However, previous low can help in determining the breakouts.
We have thus developed open v/s high-low feature for traders to identify intra-day trading strategies and even the ‘%chg’ option plays an important role for intra-day traders. This feature in TruedataCheetah is shaped in such a way where a trader can certainly take position by just observing the results.
Beginners guide to stock market

Beginners guide to stock market

blog-2

Beginners guide to stock market

Most Often, gold and stocks are the investment showgrounds that attracts Indian investors. If you are someone looking to invest in shares and stocks (Stock Market) in India, and are just about to start off, here are some of the basic things you need to understand as a newbie.

What is the stock market all about?

In India, there are two primary exchanges; the National Stock Exchange (NSE) and the Bombay Stock Exchange (BSE). These are the only two exchanges in India where buying and selling of shares and commodities happen. Usually, there is a minor difference in the price of shares at the two exchanges. Your broker can guide you here in case you do not understand where to trade. 

What is the difference between primary markets and secondary markets?

When a company lands up in stock exchange with an initial public offer (IPO) it is known as the primary market. The secondary market is the place where actual trading of the shares takes place. The only purpose of an IPO is to list the stock or the company in the share market. Once the company gets listed, it starts trading in the secondary market. Buying and selling shares is largely like buying and selling any other commodity.

How are shares priced in the market?

The share prices of any company are directly proportional to the growth of the company. Usually, share prices go up when the company is growing very fast, earning very good profits or it gets new orders. Therefore, the price of a share is determined by demand & supply and growth of the company. Sometimes, some positive or negative rumors about the company affects its share prices. But this fluctuation is temporary and does not affect the position of the company in the stock market for the long term.

How much money you need to start investing in Stock Market?

Investors can start trading with even 1 share of the company. There is no minimum investment required  So if you buy a stock with a market price of Rs.100/- and you just buy 1 share then you just need to invest Rs.100. Of course, brokerage and statutory charges will be extra.

What do you need to get started?

PAN Card:

PAN (Permanent Account Number) is a primary requirement for entering any financial transactions in our country. The Tax Authorities assign this unique 10 digit Alpha-Numeric number assigned to an individual for calculating their tax liabilities

A Broker:

Brokers are the people who are authorized to buy and sell on the markets. One cannot just start trading in the stock market, without a broker. SEBI (Securities and Exchanges Board of India), which regulates the share markets provide license to the eligible individuals or agencies to trade in the stock market.
For buying or selling shares, an investor need to inform your broker about which share in what quantity you wish to buy at which price. If you are using an online trading system, you can set the price in the system at which you want to sell it.

Demat and Trading Account:

We cannot hold the shares in any physical form. It is the Demat account that will hold the stocks or shares in our name and the same will reflect in the stock portfolio. All the shares have to in a Dematerialized state or Demat state. For buying and selling shares, you need to have a Trading account. You need to open both Demat and Trading account simultaneously, in order to trade in the Indian Stock Market Once you have a broker or broking company, it will help you in opening Demat and Trading account

What are statutory charges?

Statutory charges are the government-imposed charges, just like GST or stamp duty that needs to be paid. These charges go to the government, not the broker. The fee charged by the broker is known as brokerage.

Bottom Line

Once you step into the stock market, the brokers or the brocking firms provide all this information to you, but knowing these things will help you in staying aware and invest carefully.
Studying Breadth of the Market

Studying Breadth of the Market


Studying Breadth of the Market

Studying Breadth of the Market

Market Breadth – ADS (Advance, Decline, Same) Feature in TrueData Cheetah is similar to the breadth indicator. Breadth Indicator measures the number of advancing and declining stocks using a mathematical formula. It reflects Market Sentiments. Looking at ADS,  a Trader would get an idea about how a Market Performing. It also has a third line ‘Same line’ which shows the percentage of stocks which are neither advancing nor declining, it shows stock with no % change in their close price.

The advance-Decline line can be better understood by Studying convergence and divergence:-

Convergence

bullish convergence
Bullish- when advance line converge towards decline line from bottom to above, then it’s a bullish convergence. It generally shows signs of trend reversal in the market from Bearish to Bullish.
Bearish – when advance line crosses the decline line by moving down, it leads to bearish convergence.  This typically indicates a bearish reversal in the market.

Divergence

Bearish divergence

After convergence, ADS forming new highs or new lows. This can be used to identify a trend where fewer stocks are declining and the decline in the index may be nearing an end. Thus a trader can identify a stock in a group by using ‘% chg’  for trading.
Similar trading pattern could be followed in Bearish divergence.

Ratio

Ratio

A/D ratio if above 1.25 shows a bullish trend in the market whereas if below indicates a Bearish Trend, if A/D ratio is between 0 and 1, this indicates bearish to choppy market. Using  A/A+D formula shows a strong bullish trend if above 0.60 or bearish trend if below 0.50.

This TrueData Cheetah feature is therefore significant while trading as it gives you an overall view of the market.

What is Volume Profile & How does it works?

What is Volume Profile & How does it works?


What is Volume Profile

What is Volume Profile?

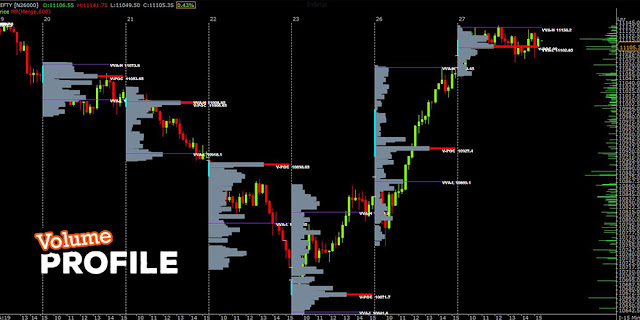
Volume Profile is a visual representation of how much volume occurs at each individual price over a certain period of time. It helps traders to identify support and resistance. By looking at the volume we can see where the most activity is taking place historically.

The important ingredients of Volume Profile include:-

·         Value area: The Value Area represents the range of volume that contains 70% of a day’s trading activity. Prices in value areas are the most acceptable prices.
·         Initial Balance: Initial Balance represents the first hour of trade to predict how the market will perform during the rest of the day or to identify volatility to avoid trading.
·         VPOC: The price that recorded the highest trading activity.
·         Value Area High (VAH): The upper level of the value area.
·         Value Area Low (VAL): The lower level of the value area.
This is used to identify Support and Resistance. Volume The profile also includes High volume nodes (HVNs) where prices are deemed as fair prices. These are the prices where traders spend most of their time. HVN attract market activity. In contrast to HVNs, where prices are deemed as unfair prices are known as Low volume nodes ( LVNs), at these prices, traders spent no or little time. LVN tends to reject market activity.

How does volume profile works?

Basically, Volume Profile takes account of total volume traded at a particular price level during the specific duration and divides the total volume into either “buy volume” or “sell volume”. This makes easier for the trader to understand the information.

How to find Support and Resistance?

The first and most important use of the Volume profile is to find basic support and resistance levels. It is a reactive method to identify support and resistance. This means the method relies on past price movements and volume behavior unlike proactive methods (such as trend lines and moving averages) which are based on current price action and analysis to predict future price movements.
It can also be helpful in applying meaning to price levels where the market has visited earlier.

Bottom Line

Volume Profile is an exceptionally valuable tool for Technical Analysis for the traders. It is a charting tool that does a variety of things that are helpful while trading
The data that is provided by Volume Profile is quite certain. While in its simplest form, it is a great reactive method for analyzing and finding traditional support and resistance areas. It is capable of comparing a real-time event (the current day’s open) with historical events (the previous day’s profile) and make the best decision based on the connection of the two.

Beginners’ Checklist for Stock Market

Beginners’ Checklist for Stock Market


Beginners’ Checklist for Stock Market

Let us begin with a very simple question – What comes to your mind when you say the word “Stock Market”?
List of most common terms include-
·         Profit and Loss
·         Money
·         Bear
·         Bulls and many more
However, this mere list of words does not constitute the stock market. The stock market is much more than that. Here is a Beginners’ Checklist for Stock Market that will help you understand the functioning of the market.

What is the Stock Market?


What is the Stock Market?

It is a mechanism where the shares of publicly traded companies are bought, sold and issued. It is one of the most important parts of the free market economy.
So, how does this market work?
The prices of the shares in the market depend upon several factors. If we understand it in simpler words, when the number of buyers is more than that of sellers then prices of shares will go up.
Likewise, if the number of sellers exceeds the number of buyers, the prices of the shares will go down.
Given the fact that we are now clear with the basics, let us now discuss what all needs to be kept in mind by beginners who are planning to invest in the stock market.

1. Set Long-term Goals Patiently


There are three things which decide your wealth in the long-term. These include investment capital, net annual earnings, and the number of investment years.
For those of you who are beginning to take a plunge in the market, you should be clear when it comes to your financial needs.
You should set the purpose and period of funding clearly right from the beginning.

2. Decide on your Risk Tolerance

Decide on your Risk Tolerance
Risk Tolerance basically means how you feel about risks and the degree of anxiety you go through when risk is present.
You should understand your risk tolerance and then make an investment. This way, you can avoid the investments which will certainly make you anxious.
It is important to note that you should never own any kind of assets which can keep you from sleeping peacefully at night.

3. Read Good Books

Read Good Books

It is rightly said that books are one’s best friend and thus according to me, the key to every knowledge in today’s date is reading.
Here are a few good books which you can start with to understand Technical Analysis.    
·         Reminiscences of a Stock Operator (Edwin Lefevre)
·         Trading for a Living (Alexander Elder)
·         Technical Analysis of the Financial Markets (John J Murphy)
·         Japanese Candlestick Charting Techniques (Steve Nison)
·         Encyclopedia of Chart Patterns (Thomas Bulkowski)

4. Follow Good Traders

Follow Good Traders

When you think of entering this exciting world of the stock market, you should know about the best traders in the world. Read about them, their strategies, books, etc. It will surely benefit you in a trading career in the long run.
For reference, here are a few well-known names in the industry –
·         Paul Tudor Jones
·         Jack Swagger
·         Alexander Elder
·         Martin J Pring
·         John J Murphy
On a final note, here are a few basics which you cannot ignore –

5. Financial Metrics and Definitions


P/E ratio, EPS – Earning Per Share, ROE – Return on Equity, and CAGR – Compound Annual Growth Rate.

6. Popular Methods of Stock Selection and Trading

You should understand fundamental and Technical Analysis to apply in stock market strategy.

7. Stock Market Order Types

Stock types such as market orders, limit orders, stock market order, stop-limit order, and trailing stop-loss orders.

8. Different Types of Investment Accounts

Cash accounts and Margin accounts are two accounts that form major trades. You should know the rules for each.
Once you are aware of all these things, you are good to go. However, you should remember that there’s a long way to go and as you progress you will come across new terminologies.
There is no field out there which won’t require you to know more about it.
Keep yourself updated and you’ll be good. Hopefully, this Beginners’ Checklist for Stock Market will give you a better understanding of the stock market functioning.