What is Volume Profile & How does it works?

What is Volume Profile & How does it works?


What is Volume Profile

What is Volume Profile?

Volume Profile is a visual representation of how much volume occurs at each individual price over a certain period of time. It helps traders to identify support and resistance. By looking at the volume we can see where the most activity is taking place historically.

The important ingredients of Volume Profile include:-

·         Value area: The Value Area represents the range of volume that contains 70% of a day’s trading activity. Prices in value areas are the most acceptable prices.
·         Initial Balance: Initial Balance represents the first hour of trade to predict how the market will perform during the rest of the day or to identify volatility to avoid trading.
·         VPOC: The price that recorded the highest trading activity.
·         Value Area High (VAH): The upper level of the value area.
·         Value Area Low (VAL): The lower level of the value area.
This is used to identify Support and Resistance. Volume The profile also includes High volume nodes (HVNs) where prices are deemed as fair prices. These are the prices where traders spend most of their time. HVN attract market activity. In contrast to HVNs, where prices are deemed as unfair prices are known as Low volume nodes ( LVNs), at these prices, traders spent no or little time. LVN tends to reject market activity.

How does volume profile works?

Basically, Volume Profile takes account of total volume traded at a particular price level during the specific duration and divides the total volume into either “buy volume” or “sell volume”. This makes easier for the trader to understand the information.

How to find Support and Resistance?

The first and most important use of the Volume profile is to find basic support and resistance levels. It is a reactive method to identify support and resistance. This means the method relies on past price movements and volume behavior unlike proactive methods (such as trend lines and moving averages) which are based on current price action and analysis to predict future price movements.
It can also be helpful in applying meaning to price levels where the market has visited earlier.

Bottom Line

Volume Profile is an exceptionally valuable tool for Technical Analysis for the traders. It is a charting tool that does a variety of things that are helpful while trading
The data that is provided by Volume Profile is quite certain. While in its simplest form, it is a great reactive method for analyzing and finding traditional support and resistance areas. It is capable of comparing a real-time event (the current day’s open) with historical events (the previous day’s profile) and make the best decision based on the connection of the two.

How do I download BSE and NSE stock prices in Excel in real time?

How do I download BSE and NSE stock prices in Excel in real time?


Excel in real time

NSE Stock Prices in Excel in Real Time – Microsoft Excel is a super software capable of doing a lot of calculations and providing results easily, some of which many Technical Analysis Applications would fail to provide.
Getting real-time data into Excel can be a very powerful tool, as the possibilities in excel are huge and only limited by your imagination.

Nifty-I Open Charts & Pricing in Excel

With only a little knowledge of Excel, you can implement new strategies/ideas, back-test them and even paper trade these strategies before going live.
Excel can sometimes do things which many Technical Analysis applications may not be able to. For eg..:—
·         Create complex trading systems and conduct technical analysis calculations directly in your worksheets.
·         Build and backtest your strategies involving more than 1 scrip eg. pair trading strategies
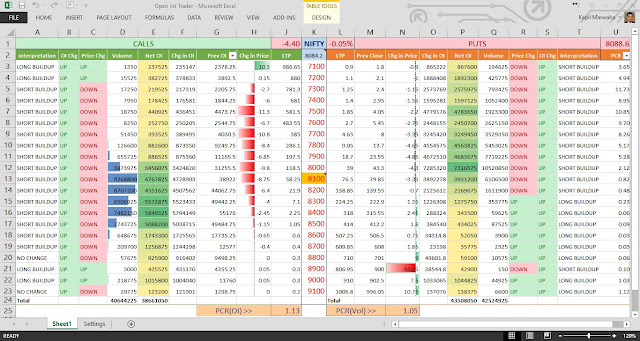
·         Very useful for tracking a large number of options simultaneously eg. Tracking their open interest/price variations, while studying the put/call ratios & option Max Pain analysis
Open Interest Strategy at Work In Excel

·         Can even help you with data mining and pattern exploration studies
·         Keeping track of complex options strategies where a number of options need to be tracked at the same time
·         Just simply tracking your portfolio in real time
·         .. and a lot more…

How can we achieve this ?

To be able to enable this ability and more, you will need to exploit the Excel’s RTD Function. The RTD function is an excellent way to retrieve real-time data from a program that supports COM automation.
Some older applications used DDE to import Real-Time Data into Excel but this is now a thing of the past as we have the more powerful and versatile RTD function in Excel.
TrueData.Velocity.2.0 is one such software which can provide you with NSE Stock Prices in Excel. This application can help you analyse 200 – 500 NSE Equities, Indices, ETFs, Futures & Options in Real-time in Excel at the same time
With Velocity, also using Excel’s ADD IN functionality to add forms, you would be able to also download Tick, 1, 5, 15, 60 min & EOD Historical Data.

Options Max Pain Chart in Excel
If you would like to know more about this integration you can get it from this Article here. [2]
Footnotes