Showing posts with label Real Time Data. Show all posts
Backtesting in AmiBroker

Backtesting in AmiBroker

 Backtesting-in-AmiBroker

Backtesting in AmiBroker

Before getting into any technicalities or know-how, it is important for us to know what do we mean by backtesting in Amibroker.

Backtesting is an easy process used by Traders to evaluate the Trading Ideas and provides information regarding how good is a trading system based on historical datasets. Precisely, it talks about the behavior of the trading system, risks involved in a particular trading system, and more regarding the performance of the trading system.

There is one such program AmiBroker which performs all these functions and does much more for the traders.

Introduction

To keep it simple, AmiBroker is a full-fledged professional Technical Analysis and charting tool which can be used by the traders to Analyse Market, prepare charts, and for backtesting trading strategies.

It is quite important for you to know about AmiBroker is before using it to backtest. Better make an informed decision rather than just going with a feature that you might regret later (which you won’t!)

Features of AmiBroker

Features-of-AmiBroker

Here is a list of features which are offered by the trading platform apart from backtesting–

Analysis Window –

analysis window

On the analysis window, you will be able to see almost everything, i.e. portfolio, walk-forward tests, optimization, backtests, explorations, Monte Carlo Simulation, and so on.

Exploration/Market Screening –

exploration

AmiBroker is a multi-purpose tool for data screening/mining which supplies programmable output with infinite rows and columns.

Charting –

This feature of Charting in AmiBroker comes with several built-in indicators, multiple time frames (which can be used as per your own convenience), drag and drop indicators, customizable parameters, object creating capabilities, etc. Sliders are the good options to modify parameters in real-time and can also customize it in various styles and gradients.

Walk-forward Testing –

It is ideal for confirming the robustness of the trading sample before and after optimization.

Multi-Threading –

AmiBroker assigns different threads for each graphics renderer and each formula chart.

Code Editor –

The code editor pairs up with parameter call-tips, auto indenting, code folding, etc. Whenever you encounter an error, a meaningful message alerts you promptly.

Ranking and Scoring –

ranking

It is used to perform bar-by-bar ranking depending upon the user score to find a suitable trade.

Advantages of AmiBroker

Advantages-of-AmiBroker

  • It provides the user with top-notch technical support for trading accounts.
  • The main features of this tool are fast array and matrix processing.
  • AmiBroker ensures that the traders are provided with safe and full-proof trading support in order to have 100% security and that you don’t lose money.
  • The features of AmiBroker are customizable and flexible.
  • It is the fastest backtesting tool and provides the user with a custom backtesting facility, custom metrics, rotational trading, etc. Also, it provides the user with advanced ranking, scoring, and positioning.

The most productive thing that can be done in the analysis window is to backtest the trading strategy on historical data. It helps you to gain insight into the strengths and weaknesses of the system before you begin to invest real money.

And thus, AmiBroker is a feature which can help you to save lots of money.

Writing Your Trading Rules

Writing-Your-Trading-Rules

The first thing that needs to be done is that you must have objective or mechanical rules to enter and exit the market. This step is necessary in order to create a base of your strategy and whether or not the system matches with risk tolerance, portfolio size, money management techniques, and several other factors.

Once you have established rules for trading, you must write to them as buy and sell rules in AmiBroker Formula Language.

Backtesting

Backtesting

In order to Backtesting in AmiBroker, you need to click on the Backtest button in the Automatic analysis window. Ensure that you have typed the formulas which contain buy and sell trading rules. Once the correct formula is entered, AmiBroker starts to analyze symbols according to trading rules and generates a list of simulated trades. This process is rapid in terms that you can easily backtest thousands of symbols in a few minutes. There is a progress window that will show the estimated completion time. If you wish to stop the process at any given point of time, click on the Cancel option in the progress window.

Analyzing Results

Analyzing-Results

When the process is completed, you will be presented with a list of simulated trades in the bottom part of the Automatic analysis window aka the Results pane. Here, you can examine when the buy and sell signals occur only by double-clicking on the trade in the Results pane. Post this, you are presented with raw or unfiltered signals for each bar where buy and sell conditions are met. If you wish to see only a single trade arrow (opening and closing currently selected trade) you are required to double click a line while holding the SHIFT key pressed down. The other option that you can choose is the kind of display by choosing the appropriate item from the context menu which appears once you click on the results pane with a right-click.

In addition to the results, you will also be provided with detailed statistics on the performance of your system by choosing the Report option.

Changing Your Backtesting Settings

Changing-Your-Backtesting-Settings

Backtesting in AmiBroker makes use of predefined values for performing its task including portfolio size, periodicity, i.e. daily/weekly/monthly, amount of commission, type of trades, price fields, interest rates, and so on. These settings can be altered by the user settings window. Post changing the settings, you must remember to run your backtesting if you wish the results to be in-sync with the settings.

Advanced Concepts

Until now, we have discussed fair simple use of the backtesting. However, AmiBroker comes with a lot more sophisticated concepts and methods.

We will be listing the new introduced-features of the back tester. There you go –

  • AFL scripting host for Advanced Formula Writers
  • Enhanced Support for Short Trades
  • Way to Control Order Execution Price from the Script
  • Types of Stops in Back-tester
  • Position Sizing
  • Round Lot Size and Tick Size
  • Margin Account
  • Backtesting Futures

Frequently Asked Questions (FAQs)

Ques. 1. What skills do I require to build an effective Algo Trading Solution using AmiBroker?

Ans. 1. Here is the list of following skills you may require to build an effective Algo Trading Solution using AmiBroker  –

  • It is necessary for you to have knowledge in AmiBroker AFL Programming, Backtesting, Optimization, System Validation of Training
  • You must have an understanding of the Broker API’s/Bridge Function and knowledge in the know-how of integrating with AmiBroker.
  • It is essential to have knowledge about VPS (Virtual Private Servers) and how to remotely connect and deploy AmiBrokers, Trading Terminal, and Bridge Components in the servers.
  • You have knowledge about Setting Risk Control Parameters and Order Execution Logic.
  • You must take data backup and trade logic backup at regular intervals.
  • It is necessary to use a statistical test like Monte Carlo Analysis to determine if the trading system has broken.

Ques. 2. Are there any additional requirements to build an effective automated trading system infrastructure?

Ans. 2. Yes, you do need additional requirements to build an effective automated trading system infrastructure.

Here are these additional requirements –

  • You must have a Good Historical Data for Backtesting.
  • It is necessary to have a Good Realtime for Live Trading.
  • You should have Trade Execution Capabilities, i.e. market order, limit order, bracket order, cover order, etc.
  • It is essential for you to have a good understanding of money management and types of systems, i.e. trend following, mean reversion, pattern recognition, seasonal, cynical, and so on.
  • It is important for you to have a sense of risk management in terms of what to trade, symbol level stop-loss, portfolio level stop-loss, fnoban check, panic button square-off, etc.
  • You require capabilities in position sizing, i.e. partial profit/loss booking, adding positions to the existing trade (scale).

Ques. 3. What availabilities does one need after taking your system live?

Ans. 3. You should have the following availabilities after taking your system live –

  • Ensure that the trading model that you use is free of glitches and that the system is tradeable.
  • You should have enough time to compute and place orders.
  • The assumptions that you make regarding trading costs, i.e. brokerage, commissions, slippage, taxes are realistic.

Ques. 4. Are there any disadvantages to use AmiBroker?

Ans. 4. Well, not technically disadvantages but yes, there are a few issues with AmiBroker which one must know –

  • This tool is not really suitable for those who aren’t tech-savvy and are unaware of the programming languages such as HTML, C/C++, etc.
  • This tool works best for those who are keen to write their own codes.
  • Since the tool is fully customizable, AmiBroker does not have a standard template, to begin with. It might not be an issue for an advanced coder, however, it can be quite cumbersome to come up with a new code or research about it.
  • The managing of quotes takes a lot of time.
  • It isn’t practically possible for you to run two or more databases per instance/session.
  • AmiBroker isn’t suitable for big traders who transact in lump-sum money and not for one-time traders or small traders.

AmiBroker is one of the best when it comes to coding, programming, developing, however, it does not satisfy those who are from a non-technical background. One requires extensive training before using the analysis and charting tool.

Even though AmiBroker has quite a number of features and tools, that makes it the trading process safe and satisfying.

We are hoping that in neat future AmiBroker will become popular among the non-technical users as well.

Till then, keep trading!
The 4 Levels of Real Time Data from NSE, BSE & MCX

The 4 Levels of Real Time Data from NSE, BSE & MCX

 Real Time Data from NSE
Add caption


Introduction

Real Time Data from NSE, BSE & MCX is distributed to various data vendors as 4 different levels.
These levels are mainly based upon the amount of RealTime Market depth (order book) provided by the exchanges.
This precision and the knowledge of Market Pricing is far more important for the day Traders than for a long term investor.

The 4 Levels of RealTime Data

There are 4 different Levels of Real Time Data from NSE, BSE and MCX (vary from market to market) :
·         Level 1
·         Level 2 / Level 3
·         Tick By Tick (TBT)

What is Market Depth?

Market depth is the order book or an electronic list of buy and sell orders. This list is organized by price level and updated to reflect real-time market activity.
Most of today’s trading platforms offer some type of market depth display. This allows the traders to see the “buy and sell orders”, waiting to be executed.
This could include the best bid and ask prices and the size of all the bids and offers.
The Market Depth, therefore, mainly segregates, the different levels of the real time data feed from the NSE, BSE & MCX.

Level I Real Time Data from NSE, BSE & MCX

Level 1 data includes only the Real Time Data of the first level in the order book.
This includes the Best Bid and Best Ask, plus the total accumulated Volumes Displayed as Bid Size and Ask Size.
Depending on the exchange the number of orders might also be made available for each side as order.
Currently, the number of orders are not provided by any exchange in India.
The Basic market data is known as level 1 market data, and mainly includes the following information:
·         Bid price: The highest price that a trader has offered and is willing to buy the asset at.
·         Best Bid size: The number of shares, lots or contracts that are available at the bid price.
·         Ask price: The lowest price that a trader has offered and is willing to sell the asset at.
·         Best Ask size: The number of shares, lots or contracts that are available at the ask price.
·         Last Traded Price: The price of the most recent trade.
·         Traded Quantity: The number of shares, lots or contracts traded in the most recent trade.
Level 1 market data provides all of the information needed to trade using most trading systems.
If you trade a price action or indicator based strategy, then Level 1 market data should satisfy your informational needs.
Level 1 Data is also sufficient for complex indicators, including Market Profile, Market Balance, Delta Divergence etc.
If you are not doing Depth of Market Trading, Level 1 data is all you need. Scalpers who trade based on changes in how other traders are bidding and offering, will need Level 2 Market Data.

Level 2 Real Time Data from NSE, BSE & MCX

This type of quotation system is a step up from the Level 1.
Data providers offer Level 2 market data at a premium to Level 1.
It offers extra information that is neither useful for normal day traders nor for long term investors.
Level 2 market data is also known as the ‘order book’. Level 2 market data shows the trader a bigger picture of the market order flow.
This because it shows the orders that are currently pending for the market.
It is also known as the ‘depth of market’ (DOM) or ‘market depth’.
This is because it shows the number of shares or lots that are available at each bid and ask prices.
In Level 1, the trader was only able to see the best prices for buying and selling.
He could not look any deeper into the details of other less competitive orders on the system.
The distribution of noncompetitive orders is important to institutional investors who plan to buy or sell large blocks of shares.
Depending on the exchange the level of market depth (of the order book) can be 5, 10 or 20 levels.
Normally the level of depth is 5 for Level 2, Real Time Data from NSE, BSE & MCX.

How can Level 2 Market Data be Viewed ?


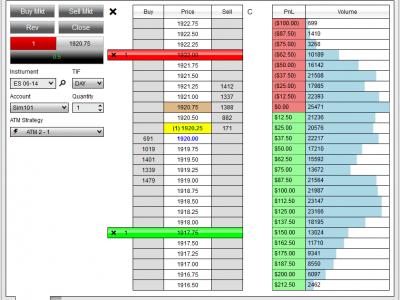
Market depth data can be viewed on a separate Level 2 window or on a price ladder.
Because market depth is in real time, it changes constantly throughout the trading session.
A “Price Ladder” or “DOM Display” shows each price level in the middle column.
The number of buyers at each price level on the left, and the number of sellers on the right.

Another way to view market depth is to overlay it on a price chart, as shown in “Charting depth” (below).This is the same data that would appear on a Level 2 window or DOM. The only difference between the two is the visual presentation.
In this example, the levels of market depth are displayed over the right-hand side of a price chart, next to the various prices.

Green bars represent the buy orders. The size of each green bar reflects the relative number of shares or lots that buyers would like to purchase.
Red bars indicate market participants who want to sell. The size of each red bar reflects the number of shares or lots that traders would like to sell.

Level 3 Real Time Data from NSE

NSE Real-Time Data also provides a 20 level deep order book. Actually, this is a subset of the Level 2 Data, known as Level 3.
Here, Level 2 provides market depth data up to 5 best bid and ask prices.
Level 3 provides market depth data up to 20 best bid and ask prices. Everything else in Level 3, is the same as Level 2.
More details of the various Levels Provided by NSE can be obtained from the NSE Website (Data Vending Info).

Tick By Tick Real Time Data from NSE

The Tick by Tick Feed is provided by the NSE. This feed consists of each and every order or a change in the order. It includes:-
·         A new order accepted & added to the order book
·         Any order canceled
·         Or, any order modified and added to order book. It contains the new and old image (i.e. price and quantity) of the order.
·         Trade – when any order is fully or partially executed.
·         Market Orders added to the book
·         Fully or Partially Traded Market Orders
This feed sends a huge amount of data. For just one symbol, say, the NIFTY future, the number of trades goes to 200 – 300 trades per second.
And this much data is not easy to handle. It also needs better applications to churn out meaningful information from this data.
This feed works best on collocated servers and LAN of the exchange.
If you required this feed at your location, from a data vendor, you would need a leased line and also a specific software different from Amibroker or NinjaTrader, which is able to crunch the huge data flowing from the exchange with micro second-time stamps.
And if you were able to do that, you would also need to be able to trade instantly.
Therefore, this feed is not for the retails traders or fund houses. This feed is best suited for High-Frequency Trading (HFT) with servers co-located at the exchange.

Main Difference between Level 1 and Level 2 Market Data?

If you are a new trader, then you only need level I market data. You can always add Level II data, later, if you wish.
Level 1 market data provides all of the trading information that is needed to display the Price Charts. This is what you will use to perform Analysis and make trading decisions.
For many traders, watching the constant flurry of changing bids and ask Prices on the Level 2 will result in information over-load. This could actually have a detrimental effect as opposed to a positive one.

Can Level 2 Data be useful?

Yes, because it not only shows, where the price is now but where it is likely to be in the near future.
Some trading strategies might require Level 2 market data. Typically, this data be used in a scalping strategy, where traders take advantage of short-term patterns are seen in the bidding/offering activities of other traders.
Also, for example, if a big fund wished to sell 5 crore shares in a medium-sized company.
Using level 1 data, they may see that the highest bid price on the market is Rs.2000 for 50k shares. The fund manager will now know that they can sell their first 50k shares at Rs. 2000.
However, the fund managers will have to accept less in order to shift the rest of their holding.
Therefore they would then trade at the next best bid price, and so on, receiving marginally less for their shares each time they exhaust an order in the market place.
It would, therefore, benefit the fund manager to be able to assess how quickly the competitiveness of the bid prices trail off before they place a large block of shares for sale.
This is called – being able to see the ‘depth’ of the market. If the competitive orders are thin on the ground then they may decide to delay their the sale or only sell a small batch.
As a result of strong demand; the fund may be able to offload its shares without moving the share price down too much and achieving the best deal for their account holders.

Conclusion

This demonstrates why level 2 data is quite pointless for your average day trader. Trading in such small quantities will rarely exhaust the bid price or offer price which they could see on level 1.
Other than very large institutions, the only other viable market participant who could fully utilize such data would be a high-speed, automatic trading the algorithm which pays extremely low commissions.
Hope, I have been able to give you an insight on the various Levels of RealTime Market Data & their implications in trading.

How to Identify Bbest Dividend Paying Stocks and Make Best Out of Them?

How to Identify Bbest Dividend Paying Stocks and Make Best Out of Them?


Dividend Paying Stocks – Although capital appreciation is the first choice of investors in comparison with dividend income, that does not make dividend less worthy. Despite the fact, that capital appreciation yields are higher; it is volatile and risk associated. On the other hand, income from the dividend is balanced and predictable.
Most importantly, Dividends are a great source of “Passive Income”. Once you have invested in the dividends, it continues to pay you for long term; you just need to buy, sit back and enjoy the consistent flow of dividends. The income from the dividends keeps growing with the pace of Company’s growth. Simply by holding a good stock for long term (10 years or more), their dividend yield itself will become high enough to beat the returns of any debt.


Suppose this person held on to his shares till year 2018. What will be his dividend yield as on Mar’18? [Additionally, company-issued bonus shares 1:1 to all shareholders between Mar’09 & Mar’18, which simply doubles the income of dividend]

So, from all the angles, investors of the dividend stocks are the gainers, without any extra effort.
In order to go a step ahead, one can also reinvest the earnings from the dividend into the same stock (during the lower phase of the stock) and increase the income further.
In this article, let’s see, what the factors are; which needs to kept mind while investing in dividend paying stocks.
Consistency in Profits and Strong Cash Flow
The very first thing you need to look for is consistent profits. If a company isn’t making steady profits, there are less chances that it would be able to deliver dividends. Profitable growth of the company is the key indicator of a quality dividend-paying company.
Also make sure, that the company has sturdy cash flow generation. Because, it is the cash flow which pays off the dividend.
For Example:

are considered good dividend paying stock as they not only pay dividends regularly, but dividend also grows with time. This is due to their regular strong cash flow.
Check Industry Strength
This is most overlooked factor, while choosing long term dividend paying stocks. If an industry is touching the roofs for past few years, it does not mean that the stocks won’t drop ever, but they’re likely to be more resilient than most stocks. And as long as the industry is in prosperous mode, there is more chance for increase in dividend, over the period of time.
In order to identify potentially good dividend-paying companies, do the following research
·         Dig into the financial reports. Look for the profit and loss account of the company.
·         Check, how much the Earning per share (EPS) of the company has grown in last 5 years.
·         Check if dividend per share of the company has grown in last 5 years.
·         Relate, if EPS growth and dividend per share growth are similar. If this is so; it is a good sign for you. Growth in EPS indicates that the net profit of the company is improving and Dividend per share growth mean that the company believes in idea of paying dividend to the investors. Therefore, having similar EPS and Dividend per share means, as the profits of the company upsurges in future, it will increase the dividend pay out to the investors.
Bottom Line
Dividends are long term investments. Dividend payment is a process by which company share its net profit with its stockholders. Good dividend paying companies are more likely to increase its profits over time. As the profits improve, dividend payment by the company also rises.

In 2019, some of the top dividend paying stock in India are:
1.      Ingersoll Rand
2.      Wall Street Fin
3.      IOC 
4.      National Steel and Agro Industries
5.      21st Cent Mgmt
6.      Vedanta
7.      Merck
8.      Shervani Industries
9.      Nalco
10.  Polyplex Corp
Ninja Trader Indicators is one of the best tools that can help you identifying the Structure of the Current Market while giving you better understanding of market dynamics, so that you make right decisions on investing in long-term and short term stocks.